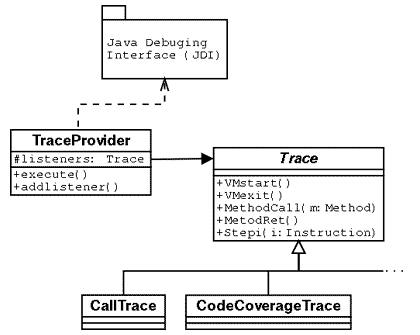
Figure 1 - Uml class diagram of JTracor framework
JTracor : A framework to trace execution of JAVA programs
What is JTracor
Currently, Jtracor is just a little framework we use to trace execution of
JAVA programs. Most of tools to collect informations at execution time use code
instrumentation but JTracor doesn't need any code instrumentation and can trace
programs even if their source code isn't available. Indeed, JTracor take avantage
of debuging facilities provided by the Java Virtual Machine (JVM) architecture.
It use the Java Debuging Interface (JDI) to launch the program to trace in a
debug JVM and notify an interface as events occured in this interface.
Figure 1 presents the class diagram of the framework :

Figure 1 - Uml class diagram of JTracor framework
JTracor mainly define a class TraceProvider that wrap trace functionalities of the JDI and an interface Trace. Using those classes, it is easy, by implementing Trace interface, to define classes which compute any kind of execution trace. On figure 1 for instance, two classes are defined. The first one computes a trace to report method calls, and the second one the code covered by the traced execution. Figure 2 shows the output obtained by both classes while executing a test case on our Virtual Meeting system.
Method calls trace |
Code Coverage Trace |
| CALL Server.exec |
Command.java : 44, 46, 49, 52, 53. LanguageMsg.java : 41, 42, 43. User.java : 72, 73, 74, 75, 76, 123, 161, 162, 165, 166, 167, 168, 169. Connect.java : 23, 28, 30, 35, 38, 44, 45. Message.java : 66, 67, 68, 69, 70. DummyServer.java : 34, 35, 36, 37, 38, 39, 40, 41, 42, 43, 44, 46. UserState.java : 6. Server.java : 142, 145, 146, 148, 149, 150, 156, 158, 164, 238, 239, 240,244, 255, 257, 259, 261, 265, 266, 267, 269, 270, 271, 273, 274, 276, 280, 281. ServerMessages.java : 80, 81. [...] |
Figure 2- Partial execution traces obtained with JTracor
Related work
We currently use JTracor framework for several studies on testing object-oriented
systems :
Repartition of method call in the instruction flow in OO systems.
Object interactions coverage : Planning OO systems integration.
Code coverage and automatic test cases generation using bacteriological algorithms.
Test cases classification using automatic classification algorithms.
Related links
Java Platform Debugger Architecture : Documentation provided by sun on the Java Virtial Machine debuging features.
JDI API documentation : The API documentation of the Java Debuging Interface.
JSequence : A comercial tool to semi-automaticaly draw sequence diagram. This tool is based on JDI to reverse-engineer interactions between objects.